Methodology: Analyzing News Images for 3D Virtual Simulation
SPRING QUARTER 2025
5/28/2025
Overview
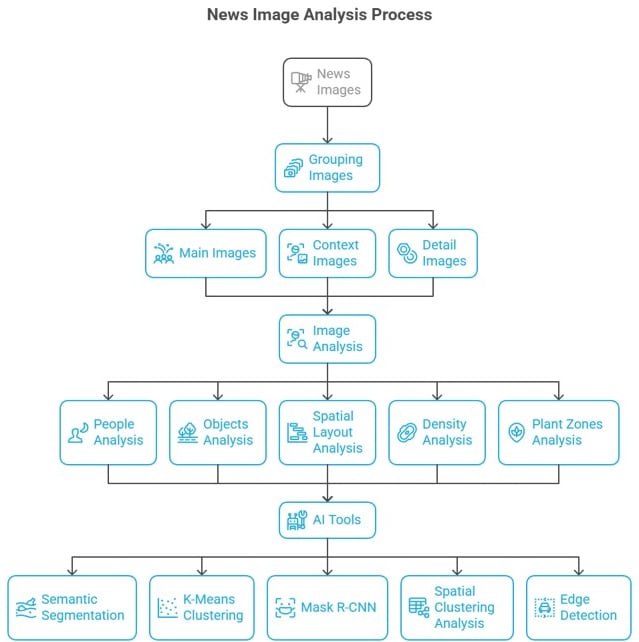
This methodology presents a systematic approach for analyzing news photographs and converting them into three-dimensional virtual environments. The process combines computer vision techniques with deep learning algorithms to extract spatial and contextual information from 2D images.
Image Classification Framework
1. Main Images (Primary Data Sources)
Definition: Images that directly capture the central event or subject
Characteristics: High information density, clear focal points
Processing Priority: Primary reconstruction source
2. Context Images (Environmental Data)
Definition: Images showing surrounding areas and background environments
Characteristics: Wide-angle views, environmental context
Processing Priority: Spatial reference and scene boundaries
3. Detail Images (Feature Enhancement)
Definition: Close-up images focusing on specific elements
Characteristics: High-resolution details of people, objects, or features
Processing Priority: Texture and detail enhancement
Analysis Methodology
Phase 1: Human Element Analysis
Objective: Extract demographic and social indicators
Process:
Skin tone detection using color space analysis
Clothing pattern recognition through texture analysis
Social class indicators through object association
Behavioral analysis through pose estimation
Tools: OpenCV color detection, convolutional neural networks
Phase 2: Object and Environment Detection
Objective: Identify and classify physical elements
Process:
Building structure recognition using edge detection
Vegetation identification through color and texture analysis
Infrastructure mapping (roads, paths, utilities)
Terrain analysis using height and surface patterns
Tools: Mask R-CNN, semantic segmentation algorithms
Phase 3: Spatial Layout Analysis
Objective: Understand three-dimensional relationships
Mechanisms:
Random Distribution: Objects with no clear pattern
Grouped Clustering: Related objects positioned together
Regular Patterns: Systematic arrangement of elements
Process:
Apply spatial clustering algorithms
Calculate density measurements
Map object relationships and distances
Tools: K-Means clustering, DBSCAN algorithms
Phase 4: Density and Distribution Mapping
Objective: Quantify spatial occupancy
Measurements:
Population density per square meter
Object concentration ratios
Empty space identification
Traffic flow patterns
Methods: Grid-based analysis, heat mapping
Phase 5: Vegetation Zone Detection
Objective: Identify and classify plant life areas
Process:
Green space detection using HSV color space
Plant type classification through leaf pattern analysis
Growth density measurement
Seasonal variation assessment
Tools: Color space conversion, pattern recognition
Technical Implementation
1. Semantic Segmentation Pipeline
Input Image → Preprocessing → Deep Learning Model → Pixel Classification → Object Masks
Framework: OpenCV + TensorFlow/PyTorch Output: Classified pixel maps for each object category
2. K-Means Clustering Process
Feature Extraction → Distance Calculation → Cluster Assignment → Centroid Update → Convergence
Application: Color grouping, texture similarity, spatial clustering Parameters: Number of clusters (k), distance metrics, iteration limits
3. Mask R-CNN Object Detection
Image Input → Feature Extraction → Region Proposal → Classification + Segmentation → Output Masks
Capability: Simultaneous object detection and pixel-level segmentation Accuracy: Instance-level object identification
4. Spatial Clustering Analysis
Algorithm: DBSCAN (Density-Based Spatial Clustering) Parameters:
Epsilon (neighborhood radius)
MinPts (minimum points per cluster) Output: Spatial relationship maps
5. Edge Detection Implementation
Methods:
Canny edge detection for sharp boundaries
Sobel operators for gradient-based edges
Laplacian filters for zero-crossing detection
Application: Object boundary definition, structural analysis
3D Reconstruction Workflow
Step 1: Data Integration
Combine analysis results from all image types
Create unified coordinate system
Establish scale relationships
Step 2: Depth Estimation
Use multiple images for stereoscopic analysis
Apply structure-from-motion algorithms
Generate depth maps
Step 3: 3D Model Generation
Convert 2D segments to 3D meshes
Apply texture mapping from original images
Optimize polygon count for real-time rendering
Step 4: Virtual Environment Assembly
Position 3D objects in virtual space
Add lighting and atmospheric effects
Implement collision detection and physics
Quality Control Measures
Validation Methods
Cross-reference multiple images for consistency
Manual verification of critical elements
Automated accuracy metrics
Error Correction
Iterative refinement of segmentation
Manual adjustment of problematic areas
Fallback to traditional modeling techniques
Expected Outcomes
Accurate 3D Models: Geometrically correct representations
Interactive Environments: User-navigable virtual spaces
Educational Tools: Immersive learning experiences
Research Applications: Data visualization and analysis platforms
Conclusion
This methodology provides a systematic framework for converting news imagery into interactive 3D environments. The combination of multiple AI techniques ensures comprehensive analysis while maintaining accuracy and detail necessary for realistic virtual simulation.